
Implementing Pulldowns and the Correlation between Mound Velocity and Pulldowns
Implementing Pulldowns & The Correlation To Mound Velocity
By Greg Vogt
Overview
A hot topic in baseball training revolves around high-intent throws to develop throwing velocity. Often referred to as “pulldowns” or “run n guns”, these throws are used to train the body to move explosively and produce a high velocity while improving movement patterns. Several training facilities implement them while some are highly critical of them.
Texas Baseball Ranch and Driveline Baseball are two of the most popular training facilities that utilize this training modality as one piece of their arm conditioning and publicly support it with data. They have been very open and transparent with how high intent throws are incorporated into a complete approach of velocity development. That being said, it has been very controversial on social media with the baseball community and programs who believe in other styles of training.
A training environment must push the stimulus to or slightly past limitations so the body can adapt to higher levels. Ron Worforth noted in his recent article (Texas Baseball Ranch) that Paul Nyman emphasized “The Bernstein Principle - The body will organize itself based upon the ultimate goal of the activity.” When challenging the body to organize in a way that demands maximal output, the movement patterns and intent are often improved. This includes weight training, high-intent throws, and medicine ball drills. It goes much deeper than just pulldowns with this principle when teaching athletes the importance of intent and how the body moves at a high intensity.
Long Toss became a very common training tool thanks to Alan Jaeger’s programming (https://www.jaegersports.com) over the past 10-15 years. Although it is not a new training tool, it is used much more commonly nationwide and his education to athletes all across the country has been pivotal. As a part of long toss, compressions (pulldowns) come after the high-arc distance throws. While just one piece of a puzzle, the compressions have value to advance arm conditioning levels for both arm health and velocity. Several programs practice and believe in different phases of this programming.
The goal here is understand not only what pulldowns are but also why or how they should be used with athletes of different ages.
What are Pulldowns?
A pulldown is a throw made with maximal intent after building up speed in some sort of running start. Athletes use a variety of footwork to get to release. Some incorporate a shuffle step, some a full crow hop, but most often you see a running start into a crow hop when the most criticism occurs. The point is to throw the ball on a line as hard as possible, doing whatever is needed to get that level of intent.
The baseball community resorts to criticizing pulldowns in this timeline over past few years:
Pulldowns will get you hurt (disproven)
Not worth it (for who?)
It doesn’t translate (discussed below)
There has been data, studies, and blogs written about the use of pulldowns and what actually occurs. The most common source of information comes from Driveline Baseball where they have written multiple blogs with studies including use of the Motus sleeve to track the stress levels of intent throws.
Why Pulldowns?
Why use pulldowns? Throwers will program themselves to move as cleanly as possible when we are throwing with max intent. This doesn’t mean they will move perfect, but often their movement patterns will look better than they do in a coached setting. Most athletes are overcoached when trying to organize their bodies to throw hard.
Pulldowns are one way to let an athlete train in a loose and free environment. Building up the intent of just attempting to throw as hard as possible in a low volume setting has extreme value with developing athletes. Pulldowns let athletes get rid of all the mental and physical cues that coaches often cram into their minds.
Now, a huge aspect of doing pulldowns is evaluating the movements within them. Videoing, assessing, and communicating the movement patterns doing pulldowns is one of the best ways you can teach an athlete to move more freely. Some kids move much better in a pulldown. Some don’t.
Also, ASMI’s research has proven that it there is statistically insignificant difference on arm stress between doing pulldowns and throwing bullpens. (ASMI Research on Weighted Balls / Driveline Blog) Furthermore, Driveline has shown research that flat grounds can be more stressful than mound via data from the Motus sleeve. If no difference in stress levels, than we need to reevaluate what should be done to condition the arm for the stress workload of bullpens and flat grounds.
Regardless, implementing pulldowns into an arm conditioning program is just another teaching and training tool that is used in an environment that has the athlete training freely at a intent level that matches the game environment. There is more information below about how to program pulldowns into a conditioning program. More often than not, the dosage of a training tool is more important than the exercise itself. Pulldowns are a great tool, when managed properly, to develop intent and velocity.
Data

2021 Winter PRP Data
How and why do pulldowns correlate to mound velocity? In 57 pitchers who participated in the training program that included various amounts of pulldowns depending on the subject, there are direct correlations to velocity improvements based on age. Overall, there was a 6.1mph difference in pulldown to mound velocity. Each age group ranged between a 6.2 and 5.6mph difference, with 2018’s having the highest difference as well as the highest pulldown average velocity. The improvements in the high school program showed an average of 4.7mph in pulldowns and 3.4mph in positional velocity (15 of 72 were not tested as pitchers).
In 2020, our Winter PRP program had 112 athletes who consistently tested pulldowns and positional (mound or defensive position) velocity. This testing began after a 4-week on-ramping program. The final testing was after 10 weeks of training in March 2020. Data shows an upward trend in positional velocity based on their pulldown velocity.

Winter PRP 2020 Data
Result Analysis
Out of 93 members of the 90mph pulldown club, only nine are not currently committed or already playing collegiate baseball (as of July 2019). Three of those nine are under 17 years old and two decided to go to college without playing despite having an opportunity to play at other schools.
Does it translate?
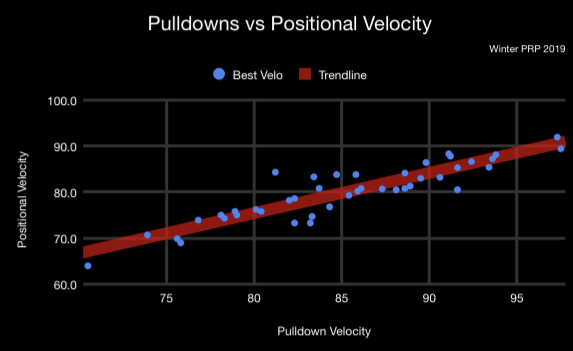
2019 Winter PRP Data
2019 Data Breakdown
22 pitchers that pulled down over 90mph within the test group averaged 86.9mph in mound velocity
>94mph in pulldowns averaged 88mph on mound (10 pitchers)
<90mph averaged 78.7mph on the mound (35 pitchers)
<85mph in pulldowns averaged 75.6mph on mound (20 pitchers)
An important piece of this data for this program was to learn more about the athletes that have big or small gaps between pulldowns and mound velocity. The average difference was about 6mph between pulldowns and mound velocity. Several pitchers had gaps as big as 10mph or as little as 1mph. This information is key and should lead to adjustments in programming for each individual athlete. A kid who has a large gap is losing connection and energy transfer in his mound velocity. The pitcher who has little to no gap between pulldowns and mound is either breaking down mechanically during pulldowns or is lacking intent during them.
Once data is collected, the conversation is more supported with numbers rather than guessing why velocity is what it is. From here, the programming can be created and adjusted based on the data at hand.
2020 Data Breakdown
of 41 athletes who pulled down 90+, the average positional velocity was 87.6mph.
of 41 athletes who pulled down 90+, only 11 didn’t peak over 85mph for positional velocity.
The average positional velocity for 15 athletes who pulled down 94+mph was 90.1mph
The average positional velocity for 28 athletes who pulled down 92+ was 88.8mph
The average positional velocity for 26 athletes who pulled down 85-89.9mph was 82.4
The average positional velocity for 24 athletes who pulled down 80-84.9mph was 77.7mph
The average difference was 5mph between pulldown and positional velocity.
When to Use Pulldowns
Pulldowns have been proven to be useful to develop intent, movement patterns, arm conditioning, and velocity. Now, this doesn’t mean go out and follow a program of pulling down multiple times a week at age 13 without getting an assessment. Pulldowns should be properly placed in a throwing program structured with long toss, weight training, and a mechanical analysis.
Steps to take before entering the “pulldown phase” of arm conditioning:
Get assessed by a PT
Video Analysis on mechanics
Attack deficiencies of that assessment (ex: mobility, strength, throwing mechanics)
Complete 5-8 weeks of an on-ramping program including a long toss phase
Structured weight training program that includes 2-4 days a week
How to use Pulldowns in a structured way:
*Several factors could adjust the workload including age, maturity level, throwing workload, mound frequency, mechanical assessment, etc.
One time a week with 5-7 high intent throws at 100% intensity.
Include 3-4 other days of throwing between a low to moderate intensity
2-3 days rest in between moderate to high intensity throws
Structured weight training program that includes 2-4 days a week
By no means are these absolutes, but some simple guidelines on how to get into a throwing program with high intensity throws are important to follow the first time. Following a random online throwing program most likely won’t make you throw harder with an extreme risk for injury.
Summary
Developing throwing velocity should include a well-rounded training program to ensure that it is done the proper way. If certain areas are left out of training then the risk for injury can overtake the need for velocity. Several pieces of the training revolve around physical strengthening and athleticism. That being said, having pulldowns or high intent throws to develop both movement patterns and velocity should be one piece of the training.
As shown with data from several programs, the results of increasing pulldowns can also improve the mound velocity. The 57 pitchers shown in this study have an upward trendline with pulldown and mound velocity. Even the outliers can learn a lot about their deficiencies when tracking in a consistent, well-structured program.
Now, this doesn’t mean go throw baseballs hard until your arm falls off. This means that a properly structured training period following an assessment and on-ramping program can really lead you down the right path of velocity development.
For more information, e-mail prpbaseball101@gmail.com
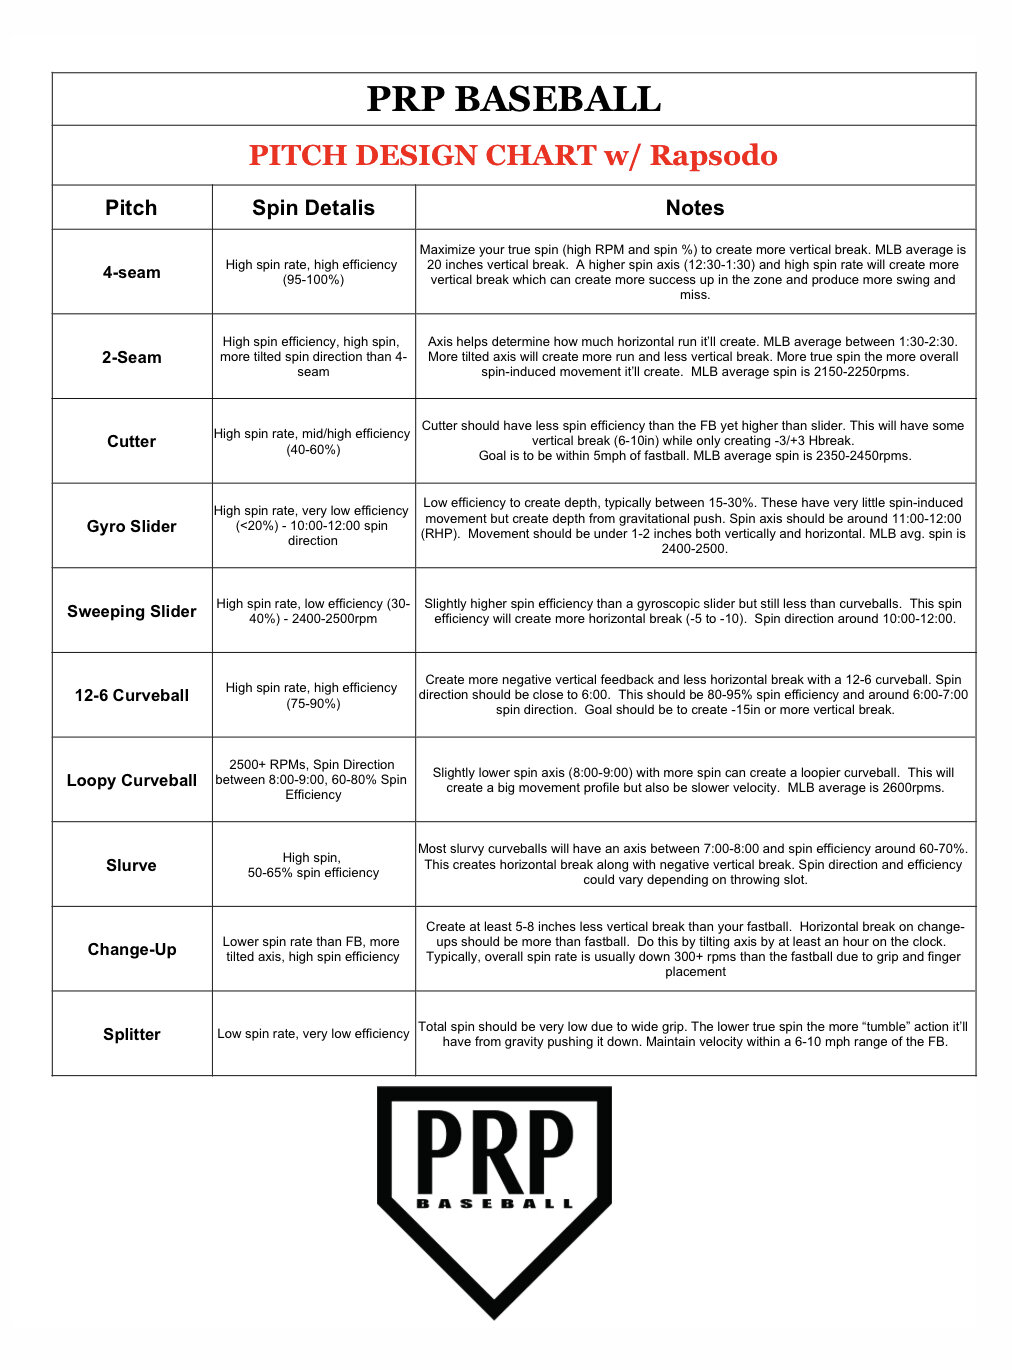
Pitch Identity and Design with Rapsodo
Overview
It’s 2020. Coaches have access to spin rates, horizontal break, and percentages of pitch types thrown in specific counts at the collegiate and professional levels. It’s time we stop telling pitchers to “pound the knees”. It’s time we stop calling every over-the-top breaking ball a 12-6 curveball. With products like Rapsodo, we have the ability to fully design and develop a pitcher’s arsenal.
What is Rapsodo? Rapsodo is a pitch tracking device that analyzes spin rate, velocity, movement, command, and provides the ability to break down mechanics. It provides immediate feedback on every pitch along with bullpen reports to analyze data from each training session.
Running, throwing, and bat speed all become bigger factors as you move to the next level. Scouts bring 3 things to a game; something to write on, a radar gun, and a stopwatch. You must check off boxes to gain attention from scouts and most of them come from a radar gun and a stopwatch.
"Throwing strikes and creating hard contact in the batter’s box is always going to be important, but bat speed, throwing velocity, and foot speed are still king."
Throwing velocity is the most important tool in the tool box. The other two most important pieces for pitchers are command and movement. You need to have at least 2 of the 3 to stand a chance being successful at the next levels. Velocity doesn’t solve all of a pitcher’s problems, but it is a very important box to check off for scouts and recruiters. When developing the other two pieces, Rapsodo becomes a critical measuring tool for pitchers.
We are in an era where pitchers are throwing 90+mph off-speed pitches with elite horizontal and/or vertical break. For example, Blake Treinen is throwing 96-100mph sinkers that look like a left-handed pitcher throwing sliders. These major league clubs are utilizing pitch tracking data to maximize velocity and movement to create weak contact. Below is information on what pitch tracking means, how to digest it, and most importantly how it can maximize your success in-game.
What does Pitch Tracking mean?
Pitch tracking data comes from different tools like TrackMan, Rapsodo, FlightScope, and Diamond Kinetics that provide different metrics for every pitch thrown. Some only track spin rate, movement, and/or velocity. Most major colleges, almost all MLB clubs, and higher end training facilities have products like Rapsodo to use for off-season, spring training, and throughout the season. TrackMan is in several Division 1 stadiums as well as every MLB stadium. This data gets crunched by employees and companies such as BaseballSavant. Data analysts, coaches, and pitching coordinators are using this data to digest performance along with enhancing pitch design, pitch development, and pitch usage for their players. More data below in this article shows different spin rates for MLB Pitchers.
What Does Rapsodo Do?
Rapsodo has provided a product that allows us to measure everything about a pitch including velocity, spin axis, spin rate, spin efficiency, and movement while supplying reports to analyze for coaches and players. See below (Image 1), you can identify your pitches, track your velocity and command, and work on creating the best movement for your pitch arsenal (Image 2). In Image 1, the charts on the bullpen report show strike percentage for different pitches along with horizontal and vertical break of every pitch.
Image 1
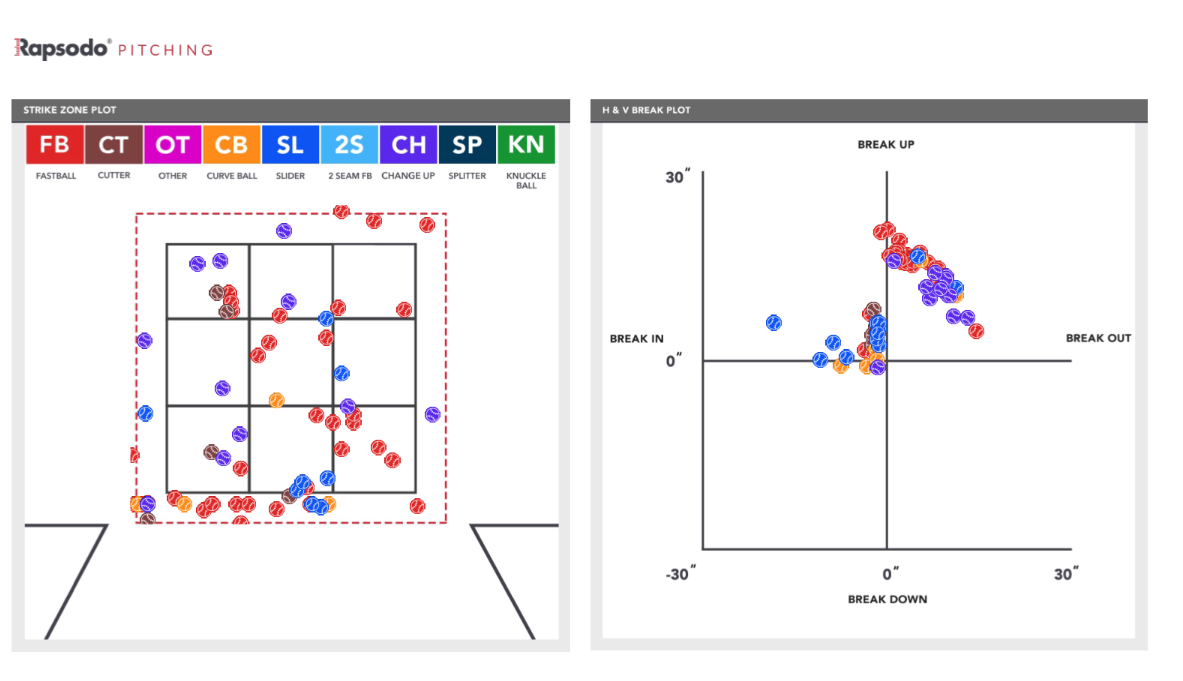
Image 2
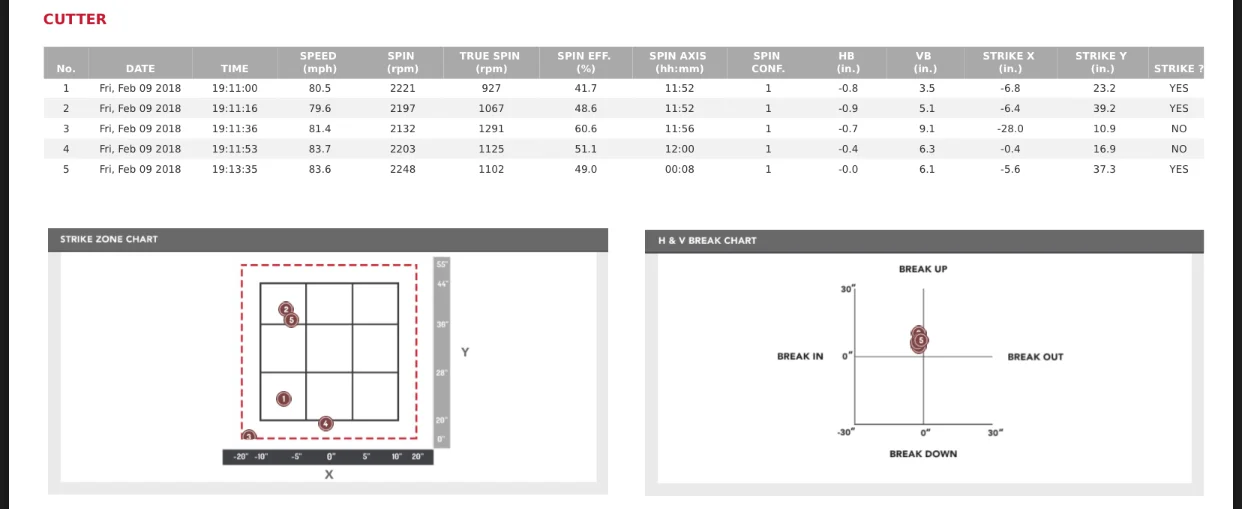
Pitch Data - Cutter - RHP
This small sample size of information is from one short bullpen that shows what is being done with the Cutter. Without this immediate feedback, pitch design becomes much more difficult to match the pitcher’s feel along with data. The Cutter shows it is moving on two different planes with little horizontal movement from spin. Two of the biggest factors are finding the consistency with axis and spin efficiency. Several key things can be abstracted from this data to apply to pitchers of all levels. The conversation between coach and player becomes much more supported by information rather than guessing. Trial and error is ultimately the best route to designing a pitch. If all we are relying on is the naked eye and video, then our rate of success will suffer.
Rapsodo can be used for all ages and skill levels, but should be a priority when working with higher level athletes who are wanting to maximize pitch efficiency. Movement being one of the key factors in pitch ability, you can get a full breakdown of your pitch arsenal in each bullpen.
Image 3
Data Usage
Now, how do we use the data? Rapsodo does a great job of supplying data. But the data means nothing without considering all factors. Pitchers generate spin and movement thanks to several variables such as delivery mechanics, slot, intent, grip, pressure distribution among fingers, etc. Just because Cy Young winners produce “x” type of spin rate does not mean you should aim to match. Numbers are different and unique to each pitcher. Your individualized skill set can be maximized in a completely different way than your peers.
For example, we know that a high spin rate fastball should be used in the top of the strike zone. It fights through gravity better which can is maximized at top of zone (Magnus Force). A low spin fastball should be kept down in the zone as gravity will drive that pitch down and produce more ground balls. With breaking balls, a heavy spin curveball with high efficiency can create heavy tilt and depth. A high spin, low efficiency (below 60%) will have less vertical break but could produce more horizontal movement depending on the axis. A slider from a low ¾ slot with low spin and efficiency will feature more depth from the gyrospin which can produce a high swing and miss rate. A high ¾ slot slider with heavy spin and low efficiency can produce the same result despite different grip, slot, and axis.
Point is, don’t aim for a “goal” on spin rate, axis, or efficiency. Collect data and analyze what is best for your delivery, grip, slot, spin, and tunnelling off of your other pitches.
"Every pitcher is an artist."
How you create your final product can be done in many ways with success. The goal needs to be that it is a repeatable, natural delivery with confidence to maximize soft contact or swing and misses.
Digesting Current MLB Data
With all of the data collection in the MLB these days, we can start to digest the importance of velocity, spin rate, movement, and the results they produce. Data shows that there are several outliers and differences between results and spin rates.
"We know that there is not one single way to develop more spin rate (legally), but there are ways to maximize pitch success within a pitcher’s current capabilities with spinning the baseball."
MLB pitchers feature different spin rates despite great results:
Yu Darvish - Fastball (4-seam) - 2564avg RPM
Gerrit Cole - Fastball (4-seam) - 2450avg RPM
Lance McCullers Jr - Fastball (4-seam) - 2301avg RPM
Bartolo Colon - Fastball (2-seam) - 2085avg RPM
Marcus Stroman - Fastball (2-seam) - 2245avg RPM
Justin Verlander - Curveball - 2803avg RPM
Clayton Kershaw - Curveball - 2364avg RPM
Charlie Morton - Curveball - 2835avg RPM
Sonny Gray - Curveball - 2890avg RPM
Madison Bumgarner - Curveball - 2356avg RPM
Seth Lugo - Curveball - 3337avg RPM
Andrew Miller - Slider - 2625avg RPM
Chris Sale - Slider - 2395avg RPM
Luis Severino - Slider - 2687 avg RPM
Carlos Martinez - Slider - 2185avg RPM
Max Scherzer - Change-Up - 1511avg RPM
Marco Estrada - Change-Up - 2026avg RPM
Johnny Cueto - Change-Up - 1520avg RPM
Kyle Hendricks - Sinker - 1932avg RPM
Jake Arrieta - Sinker - 2259avg RPM
Blake Treinen - Sinker - 2385avg RPM
Jordan Hicks - Sinker - 1985avg RPM
The average spin rate for a fastball in 2019 was 2300rpm for RHP and 2250 for LHP in the MLB.
Source: BaseballSavant
These examples show different spin rates that accomplish the same goal. The efficiency, axis, and slot are what is most important and make the biggest impact on the pitch movement. It’s easy to say that maximizing spin rate can better a pitch. When discussing breaking balls, that could be true when predicting the ceiling of a pitch. But to keep it simple, the goal is to manipulate the baseball with spin and movement. How you accomplish that can vary from subject to subject.
More spin data from 2019 MLB:
2S - 2150-2250rpm
CH - 1700-1800rpm
CB - 2500-2600
Cutter - 2350-2450
SL - 2500-2600
Splitter - 1400-1500
Here is a great link for Rapsodo breakdown for MLB spin averages and understanding the readings - https://rapsodo.com/wp-content/uploads/2019/07/MLB-PitchingGuide.pdf
Image 4 (via @mike_petriello on Twitter)

Image above (Image 4) shows that an increased spin rate and velocity can correlate to a higher swinging strike percentage.
Yes, higher fastball velocity leads to more swinging strikes. Image 4 shows data proving that higher spin rates combined with velocity usually equal more swinging strikes as well. Velocity and spin rate are also somewhat correlated. Typically a spin rate will climb with the velocity of the pitcher. Average RPM’s vary at all age levels along with velocity.
With the MLB average being 2264 in 2016 on the 4-seam fastball, this provides a general baseline for how pitchers should attempt to control the zone. High spin rate fastballs should be utilized in the top of the strike zone. Low spin rate fastballs should be utilized in the bottom of the strike zone. Those aren’t absolutes, but in general it provides a common approach that leads to weak contact. Typically, identifying a low spin rate on a 4-seam fastball leads to designing a 2-seam fastball to utilize less true spin and creating even more kill on the vertical break.
Bauer Units
Driveline Baseball posted a Blog in March of 2017 about Bauer Units.
Bauer Units = Spin Rate (RPM) / Velocity (MPH)
This equation provides coaches of all levels easier ways to compare data whether you are a big leaguer or a 14u pitcher. The MLB average was 23.9 Bauer Units. For example, a 72mph fastball at 1750RPM would be 24.3 Bauer Units (Driveline Baseball). When assessing younger athletes or lesser velocities, the Bauer Units formula is a great tool to truly assess where a pitcher stands in comparison to others. This clears up a lot of misunderstandings when working with mid-80’s HS/College pitchers with spin rates around 2,000. A pitcher throwing 84mph at 2100 will have 25 Bauer Units. This information and formula is very important when using Rapsodo for younger pitchers.
Design It
Once you have your pitch profiles, it is time to see what needs maximized while staying within your natural abilities. Here are some measurables for spin efficiency and spin rate to try to combine:
How do you design it? Knowing your spin and axis is step number one. Once you know, it becomes a trial and error process. Adjusting grips, wrist angle, pressure on fingers, and thumb placement are just a few to mention. Each pitcher has different hand and finger size. It takes time and a lot of repetitions. Pitchers must be able to “feel” release and the adjustments on the spin when learning how repeat a pitch. Inconsistent data on Rapsodo is very common when trialing a new grip or pitch. An inconsistent pitch in a bullpen setting is a set up for failure in game when it comes to pitch execution.
There are several ways to drive pitchers towards feeling differences in grip, pressure and release. Making too much of a change one way or another will make it very difficult to find a comfort zone for the pitcher.
Know your data? As mentioned before, this alone is critical to understanding where and how you should be using your arsenal. If you are a high RPM or Bauer Units 4-seam Fastball pitcher, you should be working up in the zone. If you are in the “average” category, you should trial with some adjustments in grip, pressure, and assess your 2-seam spin rates. Below average spin rate, you should be working in the bottom of the zone.
"Most pitchers have never been told to work up in the zone due to the misunderstanding of pounding the knees having a correlation to success. "
Few tips:
If want to throw a harder, higher spin rate off-speed pitch, turn it late and hard. Resisting early hand torque or “fall off” can create a higher velocity and/or spin rate. To keep coaching it simple, think fastball longer before breaking it.
Move your fingers closer together on 4-seam and 2-seam. Several pitchers create a cut action on the baseball as fingers being setup wider on the baseball allows middle finger to pull the side of baseball.
Try pressuring different fingers. Emphasize the middle finger more on a slider than a cutter. Emphasize the pointer finger more on 2-seam and sinkers.
Move the thumb! The thumb does a lot to affect spin. Notice different movements and spins on change-ups, sliders, cutters, 2-seam, 4-seam when tucking the thumb.
Collect video! Must match what you see with what you feel. Slow-motion video of behind the throwing hand will allow you to see what you may or not feel causing the results of the pitch spin and movement.
Be open to suggestions. Not one way works for just one guy. Don’t give up on a new grip or pitch just because you fail the first few reps.
These are just a few staples in developing a new pitch with or without a pitch tracking device. When using a Rapsodo in the bullpen, you can get immediate feedback whether or not moving grips or pressure changed anything with the pitch result.

Peyton Gray creates about 13-15in less vertical break on change-up compared to his fastball by tilting the axis and killing spin.
One of the biggest successes that I’ve personally had with teaching new grips and pitches is the change-up. Pitcher’s want to slow their arm action to ensure lower velocity than fastball. The change-up grip should be something that can be thrown with intent and comfort. The grip and axis will do the work while the delivery and the arm action should think fastball. The goal is to create a lower axis (2:30-3:00 for RHP) that produces lower efficiency than the fastball. This will kill velocity, create depth, and horizontal break. Typcially, this means a true spin of about 500-800 less than the pitcher’s fastball. Grips vary between pitcher’s mechanics and arm slot, but a common cue I personally use is throwing the the thumb and middle finger through the catcher’s mitt. This can motivate the pitcher to create later pronation and enhance intent. Again, this is just one example but have found success with pitcher’s at different levels.
Rep It
Designing and gaining feel for a new pitch is a love/hate relationship. It can take several bullpens before even getting a feel for the new grip or hand positioning.
Goal number one is to get comfortable with it just throwing with a catcher. This can take a while. Recommendation, add it more to your catch play when prior to bullpen. Step two, have a hitter stand in provide feedback. Step three, live at bats with data collection and video analysis to see the translation from bullpen setting to live. It is common for pitch data to change from the bullpen setting to live ABs due to adrenaline and intent.
Collecting that feedback along with batter results can provide very important information that shows the true impact of the pitch adjustment. Now, go back to the lab and see how results transferred over to live. If data wasn’t consistent, get back to work in a controlled bullpen setting.
Summary
Before getting into much change with pitch design, a personal suggestion is to tell the pitcher he has to strike out an elite hitter with his best stuff. Now, collect video and watch. Get a feel for the pitcher does when just trying to produce a filthy pitch without more external cueing. Go to work from there once you have data from Rapsodo and slow-motion video of delivery, grip, and hand positioning. Take Bauer Units, spin axis, movement, and success rates into consideration before breaking down a current pitch.
Having technology such as Rapsodo or Trackman and high-speed video cameras can separate your pitch development from the competition. The ability to digest the data and make necessary adjustments without over-coaching it is an art that is often misunderstood. By all means, pitches have been designed for well over a 100 years now but the ability to do so with immediate feedback outside of the “eye test” can expedite the process very quickly and efficiently.
Throughout a pitcher’s development, pitch design always remains key piece. Understanding the information on spin rates, movements it can cause, and how to utilize in your pitch sequencing are all important variables. Proper coaching and use of the data can separate pitchers from their peers.
The Correlation Between Medicine Ball and Positional Velocity
The Correlation Between Positional Medicine Ball to Positional Throwing Velocity
By Greg Vogt
Overview
Medicine Ball training has been used for decades when training athletes of all sports. Tracking the use and putting athletes through a variety of drills is key to developing power through different planes of motion. This study was done to see if the medicine ball assessments and throwing assessments showed any correlation in our high school athletes.
This program has used medicine ball training with variations in weight and movement patterns for multiple years with assessing velocities. There was a focus this off-season on seeing which athletes excelled in rotational power and how they moved compared to a medicine ball and a baseball. Based on video analysis and velocity, individuals received specific drills to improve rotational power, core stability, and movement patterns. Testing data was collected for pre-testing and post-testing with a 6LB Medicine Ball in the positional movement.
What We Already Know
Overloading a sport-specific movement requires the body to organize itself in a manner that produces more force. Rotational power is a key aspect to both throwing velocity and bat speed. The volume of repetitions, types of movement, and intent of the athlete are all important factors to consider when prescribing medicine ball training for baseball players. You also must take throwing and weight training workload when prescribing volume of medicine ball training.
Data Collection
With 68 athletes training for 10 weeks, medicine ball drills were one aspect of the development of velocity. Velocity assessment occurred in week 1 and week 8 of the training. Throughout the program, different drills and weights of medicine balls were used to develop movement patterns along with rotational power.
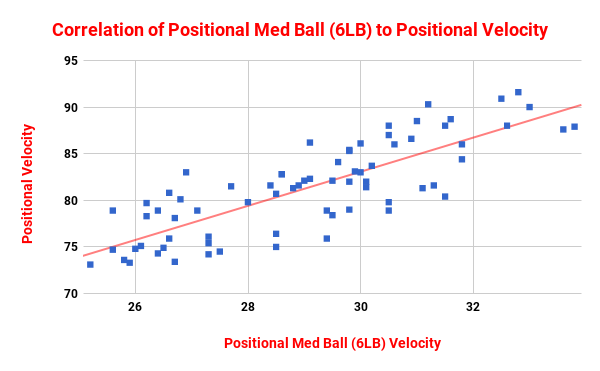
The average medicine ball velocity was 29mph while the highest was 33.8mph in the post-assessment. Our assessments included a positional throw and a run n gun with a 6 pound medicine ball. Overall, medicine ball positional velocity went up by an average of over 1.4mph while positional velocity increased by 3.4mph in the program containing 72 athletes. Some did not test Medicine Ball for different reasons. Testing shown above is for the positional throw. 15 of the top 18 throwers were over 30mph with a 6LB Medicine Ball Throw.
Data was tracked in weeks 1 and 8 for peak velocity in a positional medicine ball throw weighing 6 pounds. A Stalker Pro II was used for tracking. Athletes received up to eight 8 throws to find their peak velocity in the medicine ball throw. Throwing velocity was also assessed with a Stalker Pro II in their positional movement with up to 8 throws. Data was measured in weeks 2, 6, and 9. The peak velocity was used for final assessments and comparison.
Results
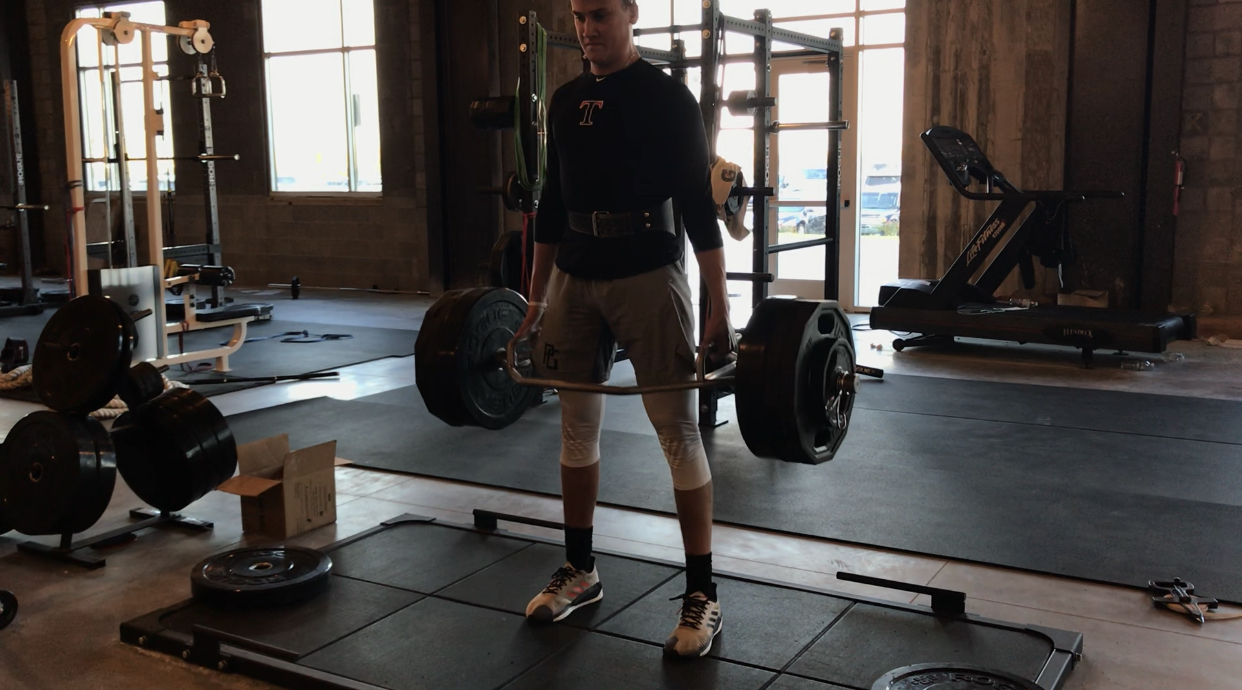
The trendline shows a steady increase correlating medicine ball and baseball velocity. The R Value was 0.81. There are also several outliers. These outliers tell us a few key things to learn from and how to program their training. A common theme in the outlier was physical strength. Those who struggled in positional velocity but tested well in a medicine ball showcased a deficiency in the trap bar deadlift compared to others with similar body weight. Measuring an athlete’s deadlift and ability to use the ground to produce force translates to how much force they can put into a medicine ball. Another common theme for outliers were body weight. Some of the lighter, more explosive athletes move well a medicine ball but fall under the trend line when it comes to mechanics and sequencing as well.

Rotational power is one the biggest pieces to throwing velocity.
A medicine ball throw is a respectable assessment to add into conditioning programs.
Outliers will provide information to help make adjustments from standard programming and help communicate that to athletes.

Free Drills:
Here are some free drills that we use and the reasoning for doing so in our training. Contact prpbaseball101@gmail.com with any questions about these drills!
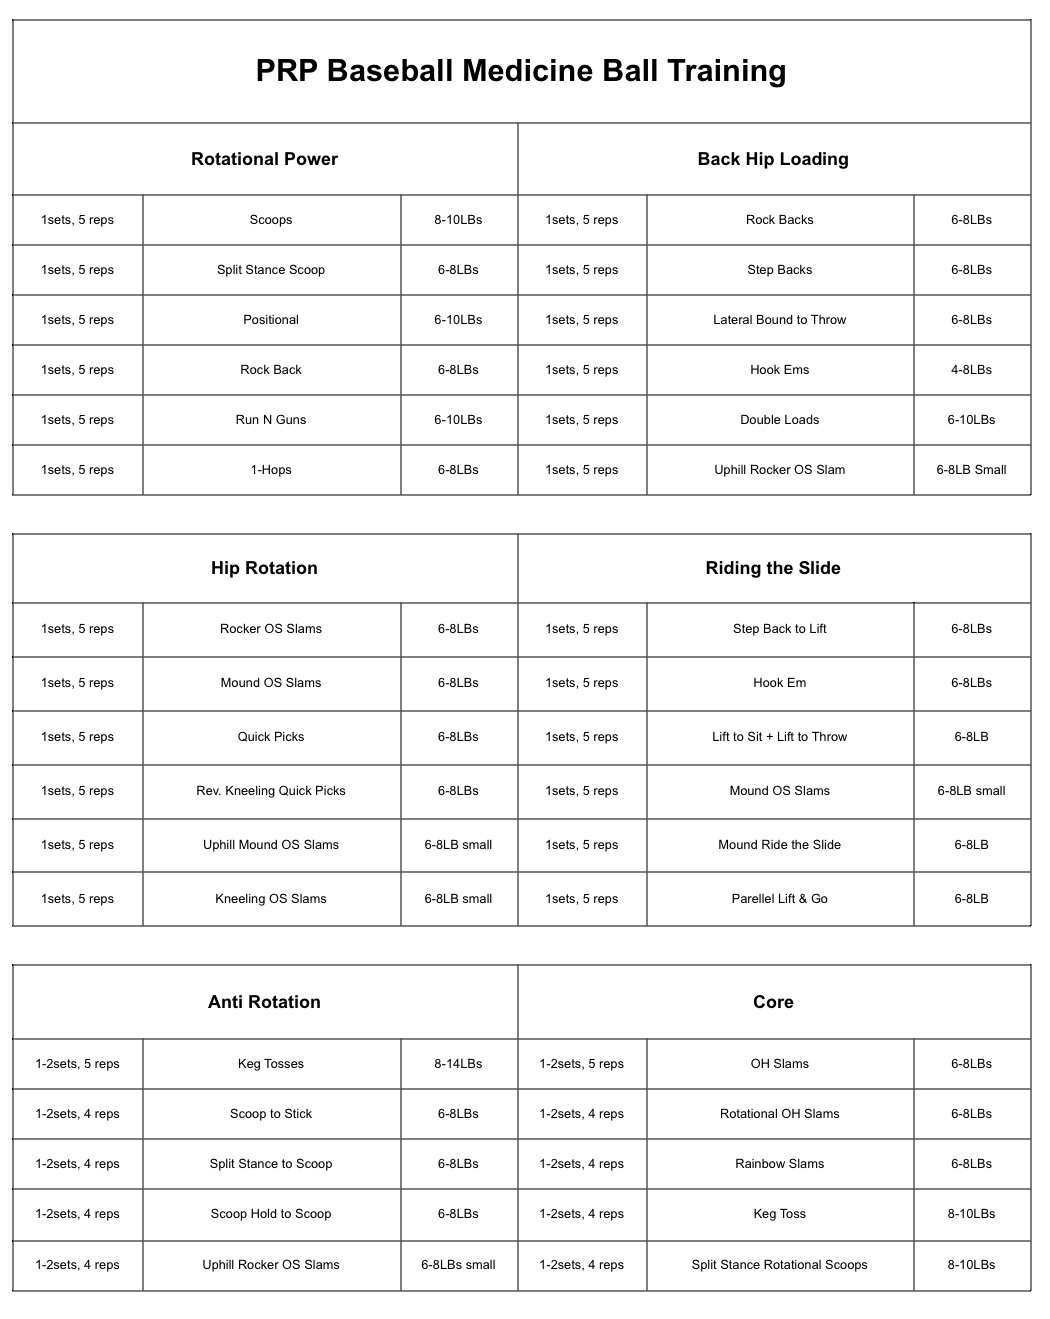
PRP Medicine Ball Drills
Summary
Medicine balls have been used years for training of athletes of all sorts. Adding practical medicine ball training can enhance the movements required to throw a baseball. These movements challenge normal throwing patterns by improving lower half usage, sequencing, rotational power, and intent. In summary, we know that medicine ball training for baseball and softball players can build stronger and more powerful athletes. Assessing and developing rotational power through plane specific training can improve your plan to develop throwing velocity. It is one piece of the puzzle that should be implemented in an individualized manner after assessment and with proper dosage.
For more information, e-mail PRPBaseball101@gmail.com or click below for Programming information.

The Correlation Between Broad Jump and Mound Velocity
We know lower half power has an impact on throwing velocity. But how do we assess it? The standing broad jump is a great tool to assess and develop that lower half power. This data shows a correlation between standing broad jump and mound velocity.
The Correlation of Broad Jump and Mound Velocity
Overview
It is not surprising to hear that lower half power output is a key factor in developing higher throwing velocity. However, assessing and developing that power in order to translate into pitching velocity is not fully understood. The two ways the lower half power output (without using force plates) are commonly assessed in the standing vertical jump (vertical power in the frontal plane) and the standing broad jump (power output in the horizontal plane).
A study was performed on high school pitchers ranging between 14 and 18 years old. The goal of this study was to see if the standing broad jump and mound velocity had a correlation. The following results (Image 1) are from the post-testing recorded in weeks 9 and 10.
Data Tracking

Winter PRP 2019
(Image 1 - 2019)
Data was tracked in Week 1 and Week 9 of a 10 week Winter Program with athletes ranging 13-18 years of age. Athletes were given 5 jumps at each test date. We took this data and measured it versus their positional velocity. There are some outliers within the data, but for the most part the athletes who had more power in their lower half were throwing harder in their positional movement.
18 of the 25 athletes who threw over 80mph jumped over 100 inches. Of the 20 athletes who jumped under 100 inches, only 7 jumped under 100 inches.
Not only does this take stress off of the arm by creating more power from the ground up, but it helps sustain velocity.
This was just one of several tests throughout the winter programming. We also assess medicine ball velocity, lateral bounds, and 10 yard dash for power output.

(Image 2 - 2018)
Assessments were recorded after a 4-week on-ramping phase that included weight training, throwing progressions, and developing mobility. Weeks 1-8 of the program included plyometrics, arm conditioning, weight training, and mobility. Post-assessment was in weeks 9 and 10 of the program. Mound velocity and standing broad jump were recorded and trained throughout the program. For the broad jump test, measurements were recorded off their back heel on a jump that was stuck without hands touching or movement in the feet. Each athlete had up to 5 jumps and the top score was recorded.
The broad jump was one measurement along with others to help determine which training modalities are important to improve and/or correlate to throwing velocity so that programming can be maximized for athletes.
24 of 28 pitchers that jumped an 100+ inch broad jump threw 80.0+mph in the post-assessment. These pitchers averaged 83.8mph in their peak velocity. The average velocity for those under 100 inches was 80.5mph. The trendline shows an increase in pitching velocity (peak) compared to their broad jump (Image 1).

There are also several outliers in the 2018 data that provide key information on how to program their training. A pitcher topping 90.3mph only jumping 90 inches shows a need for developing more lower half power while possessing efficient throwing mechanics and arm strength. This athlete needs a training program focused on power output and movement specific plyometrics.
Another outlier was a freshman in high school who shows elite lower half output with a standing broad jump of 106 inches but currently only topping 73.3mph on the mound. He also weighs 140 pounds and needs to continue developing his physical strength. Velocity should with proper training to match his lower half power output. Our 3rd best broad jump at 110 inches only topped 79.8mph on the mound as a sophomore in high school. For him, physical strength, lower half power, and rotational power were all above average for his age. His training program should focus more on improving throwing mechanics.
“Simply recording and tracking data can greatly help your chances for designing the right program for your athlete(s). However, It won’t do any good by just assessing, you must consistently track and digest what it is telling you.”
This data correlation was much more spread out than the medicine ball assessment which shows it can have its benefits but also shows several outliers within this testing alone.
Summary

As often discussed, athleticism is a key piece of projecting an athletes potential with both velocity and performance. In our testing, the best broad jumpers were also some of our best athletes. Most of our best athletes also tend to produce the most velocity regardless of an assessment. Measuring, communicating, and designing programming around tests that allow coaches to learn the athletic abilities of the athletes they coach is one step to running a successful program.
While the standing broad jump does not directly correlate to throwing velocity, it is one tool that coaches should use to help programming for athletes. In the future testings, the data can be collected more accurately by assessing the average jump distance instead of peak, along with velocity. Also, digesting the individual growth in the broad jump (or other assessments) along with the pitching velocity will provide important data on what helped specific athletes the most.
When breaking down athletes and assessing tools, the broad jump is one great tool to learning their lower half power output and athleticism. The broad jump can also be a key assessment for organizations and programs of all levels to measure lower half power and see how it correlates with their mound velocity.
For more information, contact PRPBaseball101@gmail.com
The Correlation between Trap Bar Deadlift and Mound Velocity
The Correlation between Trap Bar Deadlift (1 rep max) & Mound Velocity

Overview
Developing strength in throwing athletes continues to be a key form of training programs across the nation. The goal of tracking different tests and assessments is to find out what is the best strategy to building healthy, sustainable velocity in athletes of different levels and capabilities.
One of the main assessment tools used in this off-season programming was the trap bar deadlift. It began with an on-ramping phase and teaching the proper way to perform the lift. After a 4 week on-ramping phase, we assessed trap bar technique and reviewed form. We tested the 1 rep max the following week. Several athletes were stopped based on technique in their testing. In total, 47 athletes went through the consistent programming and assessment process with the trap bar deadlift.
Assessing a 1 rep max can be dangerous and difficult to ask for athletes of different age levels or abilities. Several athletes made adjustments into a 3 rep max or did not participate in the lift at all due to previous injuries or mobility issues.

Programming
The next 7 weeks focused on developing strength and technique through variations of weight training and plyometrics. Exercises included but were not limited to trap bar deadlift, Bulgarian squat, reverse lunges, box jumps, dumbbell bench, TRX exercises, Palloff press, sled push and pulls, lateral lunges, and several different core exercises.
There were about 20 athletes that had specific deficiencies or previous injuries required altered training programs. Theses athletes were not in the sample groups.
Several made quick improvements based on better technique and form. The biggest improvers, some up to 70 pounds, were new to the lift itself and made bigger improvements after consistent training and and workload.
Results
The post-assessment for Trap Bar Deadlift was in week 9 of the program. Those testing numbers are shown in the graph above compared to their mound velocity (peak) assessed in week 10. Overall, the average 1 rep max improved by 21 pounds for over 50 athletes (below).

Why does the trap bar deadlift assessment show similarities to positional velocity? Improving muscular strength in hopes of gaining velocity is nothing ground-breaking. However, assessing athletes, being transparent with their results and deficiencies, and training them accordingly to maximize their ability to throw hard separates this program from others.
The trap bar deadlift provides a movement that develops key muscle groups and while training ground force that provides a stable foundation for throwing. As seen in the data, our stronger athletes often throw harder on the mound. Those that made big improvements in their trap bar deadlift max also improved more than average in their positional velocity. There were outliers, but this testing provides an educational piece for both the athlete and the trainer.
Summary
In general, the trap bar deadlift is a very important piece to strength training that provides important feedback on power and force production. It is a common lift variation for athletes but has not been tracked in a large group of athletes that are all attempting to improve throwing velocity.
These athletes often participate in lifting classes that focus on the “power 3” being squat, bench press, and power clean. All three are good movements, but the baseball player needs more plane-specific movements that challenge them in similar positions used in baseball.
When combining the rotational power development of medicine ball training, lower half power output assessment in the broad jump, and physical strength in the trap bar deadlift, you are building the foundation that leads to increased throwing velocity.
Not one of these tools can answer all of the problems, but combining different assessments and training prescriptions can lead to better results.
For more information on data or training, contact PRPBaseball101@gmail.com

Process Built Training
We are misleading athletes to believe that scoreboards and trophies are king. The process of working hard and building towards that end result was where the real reward is. You can work hard at something and not get the results you want or expect but by no means does that make it not worth it. The process of learning and experiencing the work at hand is the reward.
Process Built Training
Every young athlete dreams of playing on the big stage and succeeding. Every parent dreams that their kid achieve the highest level of playing while being the happiest kid on the field. Nobody wants an athlete to have their feelings hurt on or off the field. Point being, we see scoreboards, stat lines, and trophies as the ultimatum. Our society believes in trophies solving our self-esteem issues. We often blame the youth for this issue, but who is giving out the trophies? Who sets leagues and tournaments up to provide participation medals for all players? Our youth athletes are victims of poorly organized reward systems in our development.
We are missing the point. Big time.
If you have worked hard for something in your life, you understand that the process of building that end result was where the real reward is. You can work hard at something and not get the results you want or expect. This doesn’t mean it wasn’t worth it. The process of learning and experiencing the work at hand is the reward. We are supposed to fail at things. Without failure, our learning process becomes flawed. Every result, decision, and life choice has positives and negatives. Risks and rewards. When we reward mediocrity, don’t expect to get something else in return.
Trust the Process

2019 Winter PRP Velocity Development
When we make decisions about training, playing, rewarding, criticizing, or blaming others, we must prioritize the end goal as the result of daily work. The commitment to daily work is what separate athletes of all levels and sports. How athletes get rewarded from that process is never in direct correlation of immediate results. We could go into countless stories of hall of fame athletes who were cut, billionaires that were fired, etc. At some point, those that continually trust and work at a high level will be rewarded in some shape or form. It may not be with that sport and it may not be for years to come.
Back to the main point, buying into the process of long-term development instead of short-term results such as games or stat lines. Best way to do it? Track everything that you care about. Body weight, lifting measurables, sleep, calories, velocity, K:BB ratio, quality at-bats, etc. Things that you focus on and track will continue to improve. Worry much less about W/L, batting average, or any other stat lines, and start developing for the long-term. Kids that train consistently, take care of their bodies, and see the ultimate goal will greatly improve their chances on developing the important things it takes to play at the next level.
As a coach/trainer, we enjoy any athlete that is willing to work. The good ones worry less about the results and more about the experience. Little details that lead to long-term development is what separates the good from the great. One of my favorite quotes has always been “Good is the enemy of Great” for the simple fact that it doesn’t take much to separate the elite from non-elite players. The elite simply do the little things better.
What does the Process look like?
The process is complicated. It’s never linear. There are ups and downs throughout. The process requires trust and belief that continuous dedication and passionate work will pay off in the end. Results will come. No matter how poor performance can be, bouncing back and continuing to work will build you back up.

Mound velocity is one of the several things that is never a linear process. Below is a chart of mound velocity progression for a post-collegiate athlete. While part of it was for on-ramping, the velocity continued to fluctuate for 4 months. Over time, the results continued to climb but there were several days and weeks that were frustrating. Why? Because of training workload, sleep management, nutrition, and getting comfortable with new mechanics and intent.
The focus being on the process for a 13 year old baseball player compared to a collegiate player should be similar with different goals at hand. The goal-oriented mindset should be keyed in on developing a tool or skill to impact their performance. For example, a 13 year old could be focused on improving their pro agility or 30yd dash time to develop their overall quickness and speed. A collegiate player could be focused on developing more thoracic mobility due to having chronic soreness or tightness come mid/late season. These things both require daily work and should have a detailed program.
The process looks like a daily commitment to improving your game. It is challenging, frustrating, and rewarding throughout. It pays off with more than just performance results. It shapes a better person who earns their results. The process isn’t fair at times, but will continue to push and motivate those who are willing to get their hands dirty.
Summary
No draft pick, college scholarship, or job opportunity of any sort was earned overnight. There is no overnight success. The reward at the so-called end is simply a bonus. The enjoyment will come from understanding all of the work put in to earn that end goal rather than the end goal itself. Align your priorities and discussions with the process, not the results. As parents, coaches, mentors, and educators we must understand that celebrating the small wins throughout development and training is more important than any trophy.
Without the proper development, trophies will fade away and careers will be shortened in today's game. Those that invest their time in research, assessments, and constantly are evaluating progress will continue to see improvements. Invest your time wisely!
For more information, contact PRPBaseball101@gmail.com.